Charts & Graphs
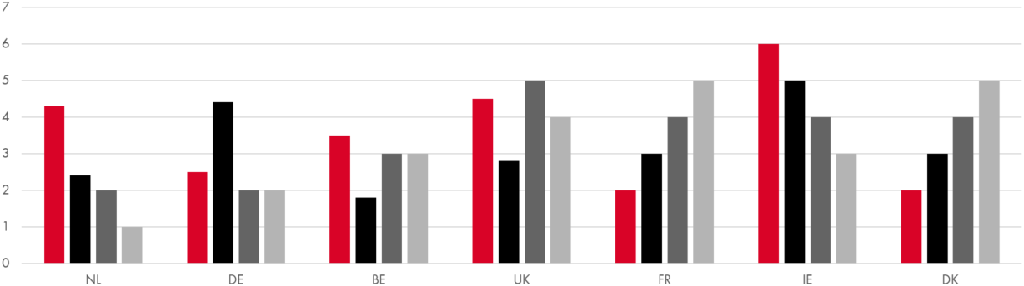
Colour scheme - 4 data points
Table 1 RGB colour scheme - 4 data points
RGB | R | G | B |
|---|---|---|---|
Red | 217 | 3 | 39 |
Black | 0 | 0 | 0 |
Dark grey | 90 | 90 | 90 |
Mid grey | 180 | 180 | 180 |
Figure 24 Bar chart example - 4 data points
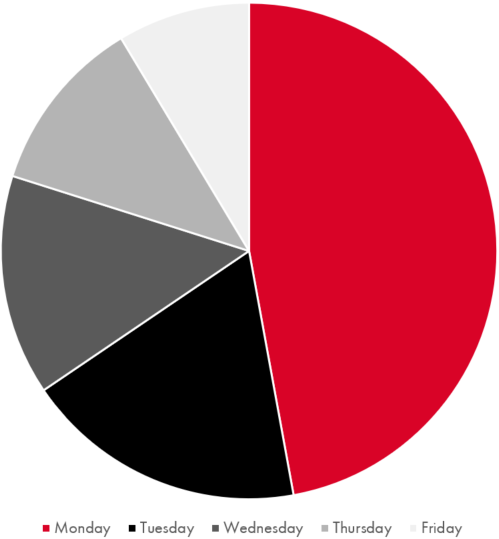
Colour scheme - 5 data points
Table 1 RGB colour scheme - 5 data points
RGB | R | G | B |
|---|---|---|---|
Red | 217 | 3 | 39 |
Black | 0 | 0 | 0 |
Dark grey | 90 | 90 | 90 |
Mid grey | 180 | 180 | 180 |
Light grey | 240 | 240 | 240 |
Figure 24 Pie chart example - 5 data points
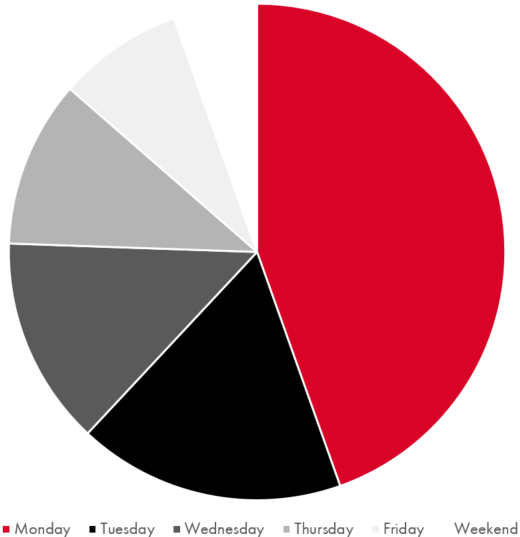
Colour scheme - 6 data points
Table 1 RGB colour scheme - 6 data points
RGB | R | G | B |
|---|---|---|---|
Red | 217 | 3 | 39 |
Black | 0 | 0 | 0 |
Dark grey | 90 | 90 | 90 |
Mid grey | 180 | 180 | 180 |
Light grey | 240 | 240 | 240 |
White | 255 | 255 | 255 |
Figure 24 Pie chart example - 6 data points
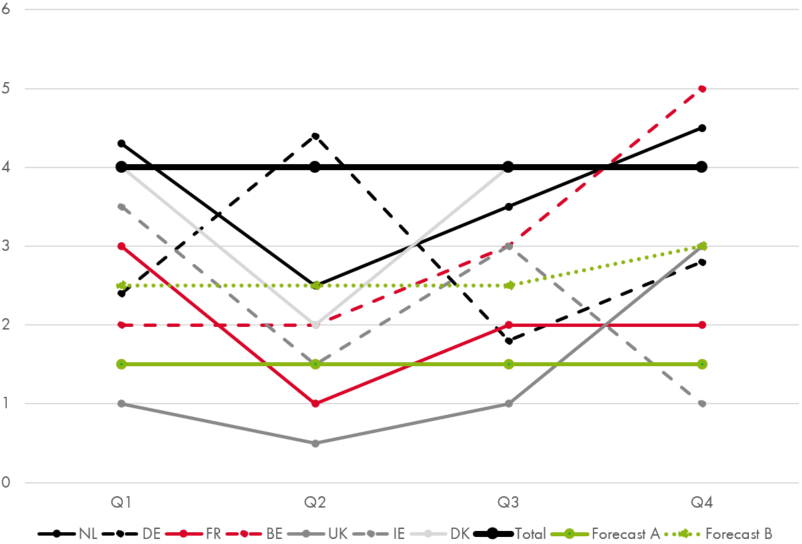
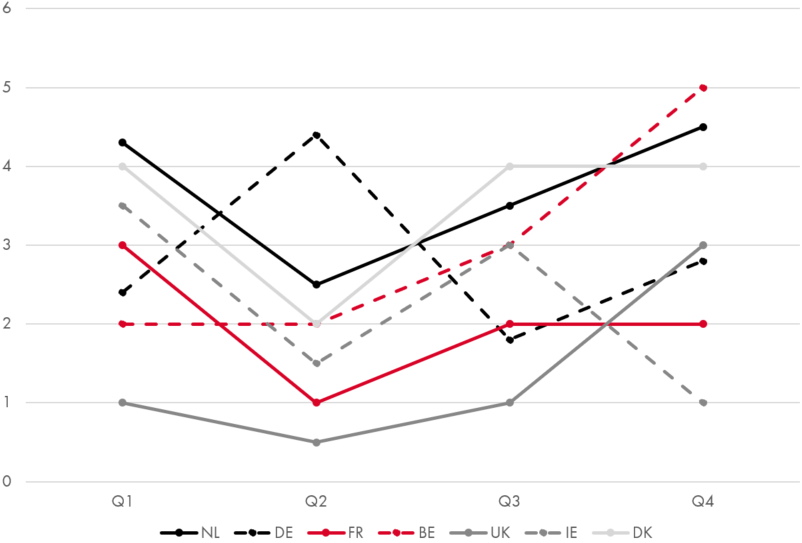
Colour scheme - 7 data points (customise)
Play with colour black, red and grey
Play with line weights and dashes
Additional grey tones:
Mid-dark grey RGB 135-135-135
Mid-light grey RGB 215-215-215
Figure 24 Line graph example - 7 data points
Colour scheme - z data points (customise)
Play with colour black, red, grey and green
Play with line weights and dashes
Figure 24 Line graph example - z data points